Page analytics
Tip: Use analytics to validate changes: publish → share → compare referrers, clicks, and geography over the same time window.
Overview
Section titled “Overview”Analytics (when included in your plan) summarizes how visitors engage with your public link pages: traffic volume, button and card clicks, top referrers and countries, device breakdowns, and recent visitors—depending on what the dashboard exposes for your role.
Availability depends on your plan.
What gets recorded
Section titled “What gets recorded”- Page views when someone loads your public page (bot traffic is classified separately from normal views).
- Link and card clicks when visitors tap your buttons and tiles.
- Direct link and other redirect events when your page configuration triggers them.
- Geo-restrictions: BLOCK and REDIRECT outcomes contribute to the corresponding metrics (redirect behavior may differ for bots—see Geo-restrictions).
- Chatbot interactions when the chatbot is enabled and used.
What you see in the dashboard
Section titled “What you see in the dashboard”Typical dimensions (exact labels may vary by UI version):
- Traffic volume — Views and clicks over a selectable period
- Geography — Country-level (and related) breakdowns where available
- Referrers — Which sites or apps sent visitors
- Devices / clients — High-level device or agent categories
- Per-link performance — Which outbound URLs earn clicks
Using the analytics UI
Section titled “Using the analytics UI”- From a page, open Analytics.
- Select a date range (presets such as 7 / 30 / 90 days or a custom range, depending on the UI).
- Review:
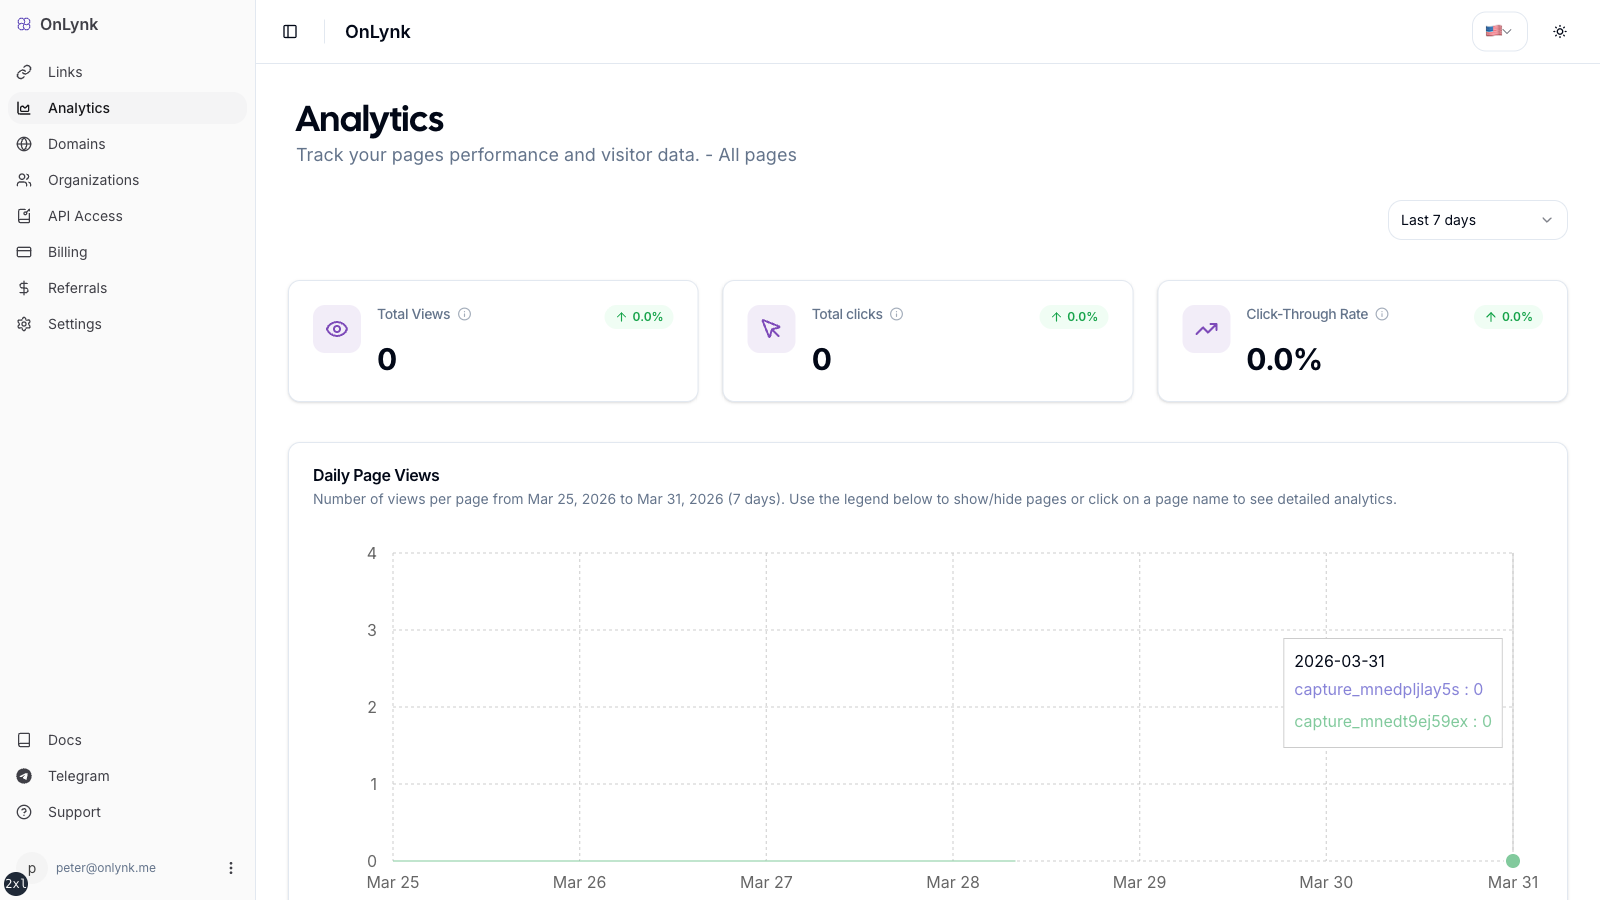
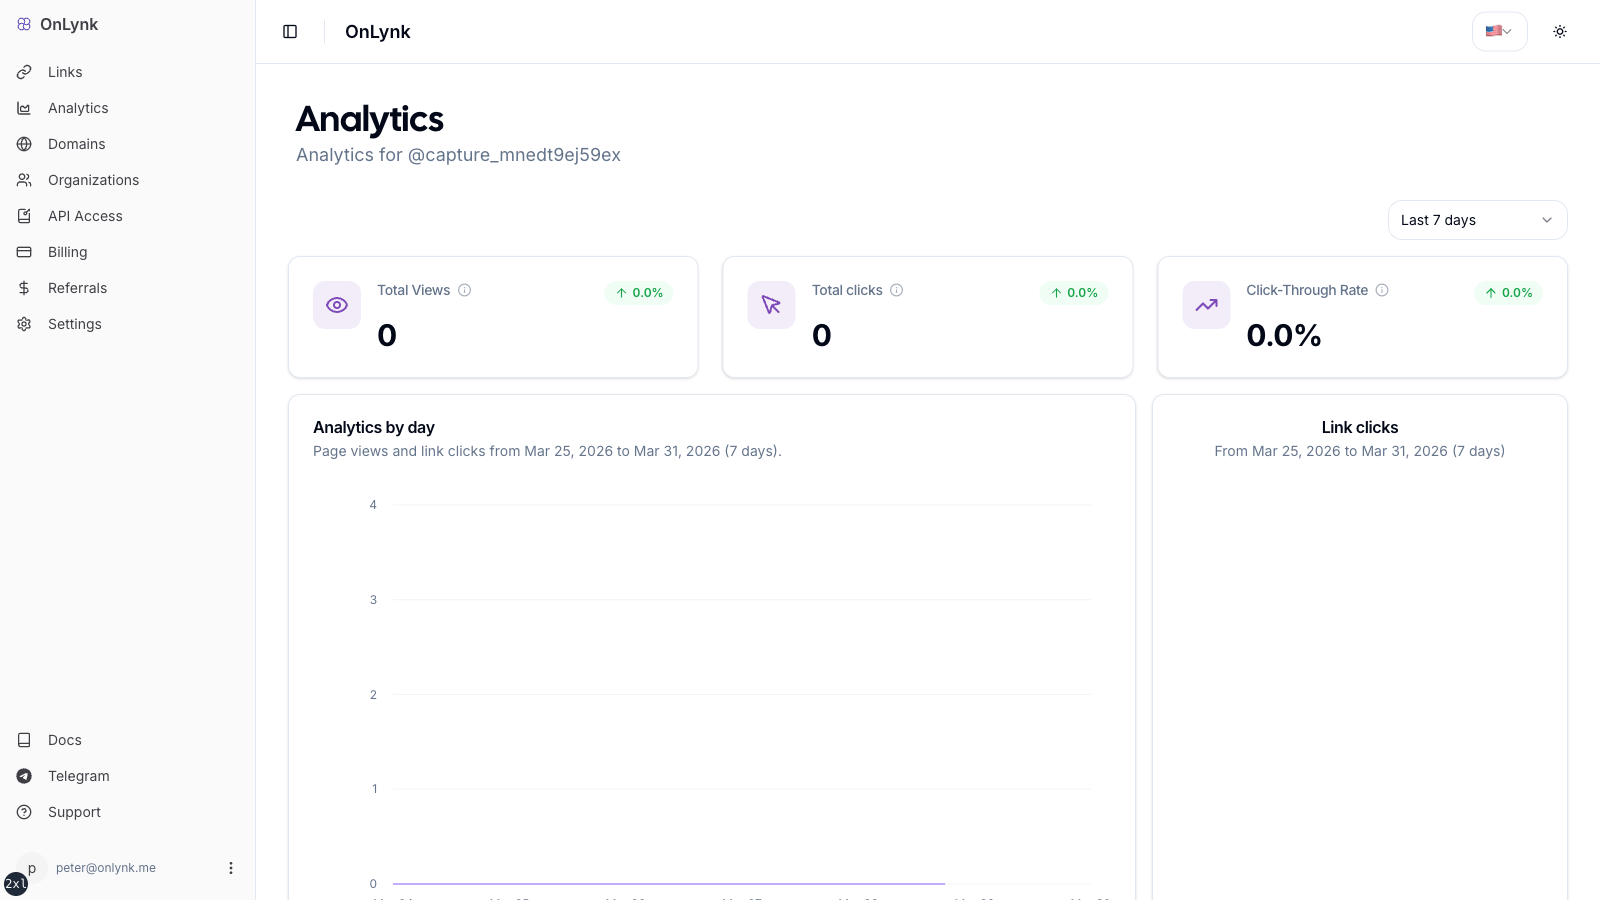
- KPIs — headline numbers for the period
- Trends — daily views and clicks
- Top links — destinations receiving the most clicks
- Referrers — where traffic originated
- Countries — geographic distribution
- Devices — device or agent categories
- Recent visitors — latest sessions (with pagination if present)
Access
Section titled “Access”- You must be allowed to open that page in the dashboard (personal author or org member with the right role).
- Your subscription must include analytics.
Limitations
Section titled “Limitations”- Some VIEWER roles may see limited or no analytics; the UI will indicate missing permission.
- Without an analytics entitlement, the analytics experience may be unavailable or redirect you away.
Public API
Section titled “Public API”If you use analytics to make decisions, keep comparisons fair: use the same time window before/after changes (new links, new cards, or a Direct link change).
Why are my numbers lower than expected?
Section titled “Why are my numbers lower than expected?”Typical reasons: the page is not published, traffic is classified as bot (and counted differently), or you have few links/cards configured so there is little to click.
Where are event type definitions?
Section titled “Where are event type definitions?”See Glossary for analytics terms used in the UI (views, clicks, referrers, and geography).